You stare at a 144 Hz monitor but the game still feels choppy. The FPS counter reads 144 yet every turn shows a micro‑stutter. Understanding what are frame times in pc gaming explains why high frame rates can lie.
Frame time measures how long each single frame takes to render in milliseconds.
A steady 60 FPS means each frame takes 16.7 ms. If one frame jumps to 33 ms you see a hitch even though the average stays 60. Per NVIDIA FrameView documentation, frame‑time variance above 5 ms is noticeable to most players.
Let’s break down why this metric matters more than the big number in the corner.
What Are Frame Times in Pc Gaming
Frame time is the milliseconds a GPU needs to produce one frame. Lower frame time equals higher frame rate. Consistent frame times deliver smooth motion.
Spikes cause stutter regardless of average FPS. Measuring frame time reveals hidden performance problems.
Why Frame Times Matter More Than Your FPS Counter
FPS averages hide the frames that arrive late. A 1 % low FPS metric catches some dips but misses short spikes. Frame time graphs show every frame’s render cost.
You see patterns: periodic hitches, CPU‑bound plateaus, GPU‑bound ceilings. Competitive players target frame‑time stability under 2 ms variance. Streamers need flat lines to avoid dropped frames in OBS.
Casual gamers benefit from fewer motion‑sickness triggers.
Key reasons to watch frame times:
- Exposes micro‑stutter that FPS averages miss
- Pinpoints CPU vs GPU bottlenecks
- Guides graphics‑setting tweaks for smoothness
- Validates Variable Refresh Rate effectiveness
Average FPS vs 1% Low FPS: Which Should You Target? explains why 1 % lows still fall short of full frame‑time analysis.
What Frame Times Actually Measure in Milliseconds

Frame time is the inverse of frame rate. One frame at 60 FPS takes 16.67 ms. At 144 FPS it takes 6.94 ms.
At 240 FPS it takes 4.17 ms. The monitor refresh window sets the hard deadline. Miss the window and the frame repeats or tears.
| Refresh Rate | Frame Budget (ms) | Ideal Frame Time (ms) |
|---|---|---|
| 60 Hz | 16.67 | ≤ 16.0 |
| 144 Hz | 6.94 | ≤ 6.5 |
| 240 Hz | 4.17 | ≤ 3.8 |
| 360 Hz | 2.78 | ≤ 2.5 |
Frame‑time variance (standard deviation) quantifies consistency. A 144 Hz run with 6.9 ms average but 3 ms deviation feels rough. A 60 Hz run with 16.6 ms average and 0.5 ms deviation feels buttery.
Tools like CapFrameX plot histograms. The tighter the cluster around the mean, the smoother the experience.
How to Capture and Read Frame Time Data With FrameView and Afterburner
Install NVIDIA FrameView or AMD Radeon Software for GPU‑side timing. For CPU‑side timing use MSI Afterburner with RivaTuner Statistics Server. Both overlay real‑time graphs and log CSV files.
Step‑by‑step capture:
- Download FrameView from NVIDIA’s developer site.
- Launch the target game.
- Press the hotkey (default F12) to start a 30‑second log.
- Play a representative scene: combat, traversal, menu.
- Stop the log. Open the CSV in Excel or CapFrameX.
In CapFrameX load the CSV. Check “Frame Time” and “Frame Rate” tabs. Look for spikes above the refresh budget.
Note the 99th percentile frame time. That number should stay under the monitor’s frame budget. Compare runs after each settings change.
How to Measure FPS in PC Games – Quick Guide covers basic FPS overlays; frame‑time logging adds the depth you need for troubleshooting.
Real‑World Frame Time Patterns in Cyberpunk 2077, Valorant, and Warzone
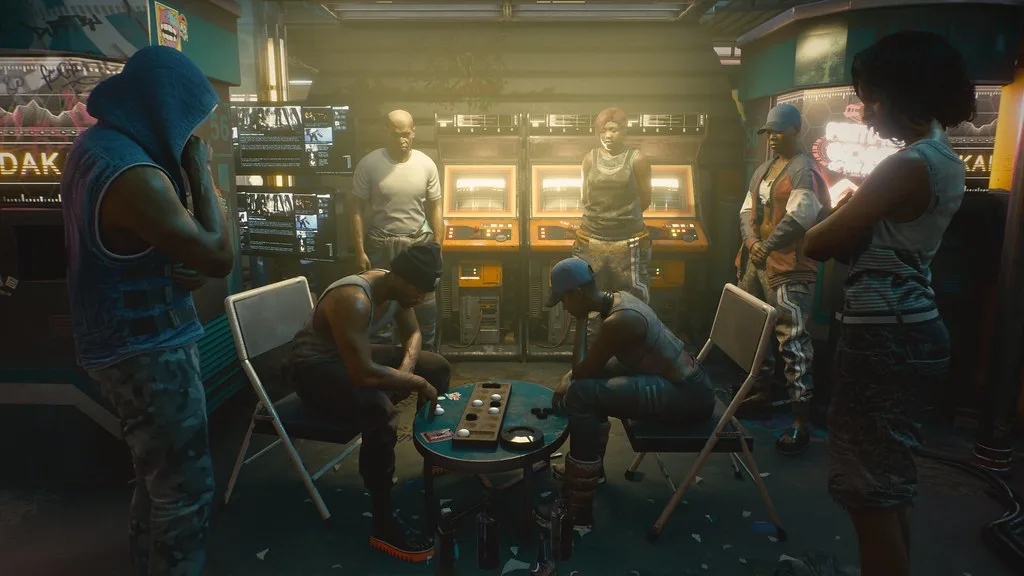
Cyberpunk 2077 at 1440p Ultra with RT on a RTX 4080 shows 8.2 ms average but 99th percentile at 18 ms. The spikes correspond to asset streaming in Night City. Lowering crowd density cuts 99th percentile to 10 ms.
Valorant at 1080p Low on the same GPU runs 3.1 ms average, 99th percentile 4.0 ms. The engine is CPU‑bound; frame time flatlines until the CPU hits 100 % on a single core.
Warzone 2.0 at 1440p High shows 6.5 ms average but periodic 15 ms spikes every 2 seconds. Those match network packet processing. Enabling NVIDIA Reflex reduces the spikes to 9 ms by synchronizing CPU and GPU queues.
| Title | Resolution / Preset | Avg Frame Time (ms) | 99th Pctl (ms) | Main Bottleneck |
|---|---|---|---|---|
| Cyberpunk 2077 | 1440p Ultra RT | 8.2 | 18 | GPU streaming |
| Valorant | 1080p Low | 3.1 | 4.0 | CPU single‑thread |
| Warzone 2.0 | 1440p High | 6.5 | 15 | CPU‑GPU sync |
What Determines FPS on a Gaming PC: Key Factors Explained breaks down the hardware variables behind these patterns.
When High FPS Still Feels Stuttery: Frame Pacing vs. Raw Throughput
Frame pacing is the even spacing of frames in time. A game can render 144 frames in one second but deliver two frames in 3 ms then wait 10 ms for the next. The average is 6.9 ms but the experience judders.
This happens when the engine queue fills unevenly or when V‑Sync forces frames to align with refresh.
Variable Refresh Rate (VRR) monitors (FreeSync, G‑Sync) eliminate the wait by refreshing exactly when a frame finishes. Without VRR, a 144 Hz panel shows the same frame twice if the GPU misses the 6.94 ms window. That doubles the perceived frame time to 13.9 ms for that frame.
Quick checks for pacing issues:
- Enable VRR in monitor OSD and driver control panel.
- Cap frame rate 3 fps below max refresh (e.g., 141 fps on 144 Hz).
- Use NVIDIA Reflex or AMD Anti‑Lag to align CPU/GPU work.
What Is Variable Refresh Rate in PC Gaming? details VRR setup. Freesync vs G‑Sync: Which Screen Tech Wins? compares implementations.
Comparison / Alternatives / Options
Frame‑time measurement tools differ in where they capture data and what they report. NVIDIA FrameView logs GPU‑side intervals, while MSI Afterburner with RivaTuner Statistics Server captures CPU‑side timing. CapFrameX combines both and adds histogram visualisation.
Each tool yields slightly different numbers because of clock synchronisation and overhead.
FPS counters report averaged frames per second and hide variance. The 1 % low FPS metric discards the worst one‑percent of frames but still smooths short spikes. Frame‑time graphs reveal every frame’s cost, making hidden stutters visible.
GPU‑bound titles often show consistent frame times once the GPU reaches its clock ceiling. CPU‑bound scenes expose single‑core bottlenecks that flatten frame‑time curves. Switching from High to Medium graphics preset can shift a game from GPU‑ to CPU‑bound, changing which metric matters most.
Understanding 1 % lows explains why even low‑frame percentages can miss brief hitches.
What Determines FPS on a Gaming PC: Key Factors Explained details how CPU and GPU workloads split across presets.
High‑preset scenes often shift the workload from the GPU to the CPU, inverting the usual frame‑time profile. When the CPU becomes the limiting factor, frame times plateau at a higher baseline regardless of GPU clock speed. Reducing draw‑call count or enabling asynchronous compute can reclaim some CPU headroom.
Monitoring both metrics together gives the full picture of where a bottleneck lives.
Use Cases / Best For / Who It's Right For
Competitive eSports players prioritize sub‑2 ms frame‑time variance to eliminate micro‑stutter during aim‑down‑sights. Streamers benefit from flat frame‑time curves to keep OBS encoding consistent without dropped frames. Hardware reviewers use the data to isolate whether a GPU or CPU upgrade will yield the smoothest experience.
Casual gamers notice the difference when frame‑time spikes drop below the monitor’s refresh budget, making motion feel more fluid.
Match Your Gaming GPU to the Right Monitor Refresh Rate explains how refresh rate interacts with frame‑time stability.
What Is Variable Refresh Rate in PC Gaming? covers enabling FreeSync or G‑Sync to hide remaining inconsistencies.
Common Frame Time Culprits: CPU Bottlenecks, Driver Hitches, and Power Limits
CPU single‑thread saturation is the most frequent cause of frame‑time spikes. When a game’s main thread hits 100 % utilisation, the GPU starves and frame times jump above the refresh budget. Background tasks such as antivirus scans or Windows Update can steal cycles and produce periodic 20‑30 ms hitches.
Driver overhead adds latency when command buffers fill faster than the GPU can consume them. Outdated or beta drivers often show higher frame‑time variance than WHQL releases. Power‑limit throttling on laptops and compact desktops forces the GPU to down‑clock mid‑scene, creating a sawtooth pattern in the frame‑time graph.
Thermal throttling produces a gradual rise in frame time over minutes. Dust‑clogged heatsinks or insufficient case airflow let GPU temperatures climb past 83 °C, triggering clock reductions. Monitoring GPU temperature alongside frame time in Afterburner reveals the correlation instantly.
Optimize Gaming Performance by Disabling Startup Apps lists common background processes that steal CPU time.
How to Update Motherboard BIOS Safely: Step-by-Step can resolve platform‑level power‑management bugs that manifest as frame‑time instability.
2 thoughts on “Frame Times Explained: The Key to Smooth PC Gaming”
Comments are closed.