When you finish a benchmark run and see a wall of numbers, it's easy to feel lost. Knowing how to interpret gaming pc benchmark results is the difference between knowing your hardware is performing well and thinking you need an upgrade. Most people glance at the average frames per second and stop there, but that single figure hides a lot of story.
The real picture emerges when you look beyond the headline.
Start by understanding that a 60 fps baseline is commonly used for console gaming, while 144 fps is typical for competitive monitors. These numbers come from industry testing standards such as the VESA DisplayHDR specification, which defines performance tiers for displays. Without a clear target, any score can look impressive or disappointing.
With that in mind, let's dive into why raw numbers can be misleading.
How to Interpret Gaming Pc Benchmark Results
Interpret benchmarks by checking average FPS and minimum FPS. A high average can hide stutter if frame times spike. Compare numbers to your target framerate for each game.
Determine whether the CPU or GPU is limiting performance. Use this data to decide if an upgrade will help.
Why Your Benchmark Numbers Feel Meaningless
Raw numbers without context are just noise. A score of 120 fps in one title might feel great, but it tells you nothing about how it runs in another. Most benchmark tools report an average, yet averages smooth out the dips.
A game that runs at 150 fps for ninety seconds then drops to 80 fps will still show a high average. Frame pacing matters because two cards can both average 100 fps, yet one delivers consistent 100 fps while the other swings between 120 and 80. The second card feels choppy.
Resolution and settings change everything. A result at 1080p ultra is not comparable to 4K low. Always note the exact configuration before you compare.
Many gamers also confuse a benchmark with a definitive verdict; in reality, [what a benchmark is] only captures a snapshot of one moment.
Frame times, measured in milliseconds, reveal how long each frame takes to render. A steady 8 ms indicates smooth motion, while a spike to 20 ms creates a visible stutter. Average fps hides these spikes, so always glance at the frame‑time graph if the tool provides one.
Different benchmark tools report different metrics. Some focus on GPU only, while others include CPU and storage. Understanding what each tool measures prevents misinterpretation.
Common misinterpretations include:
- Treating a high average as proof of smooth gameplay
- Ignoring minimum fps values
- Comparing scores across different settings or resolutions
- Assuming synthetic tests reflect real‑world performance
Avoid these pitfalls and you will read your results with clearer eyes.
Pick Your Performance Target Before You Test
Before you fire up any benchmark, decide what performance you actually need. Your target framerate should match the games you play and the monitor you use. Competitive shooters often aim for 144 fps or higher, while single‑player adventures feel fine at 60 fps.
A 240 Hz monitor raises the bar for esports titles, but it is overkill for a story‑driven RPG.

Image source: Wikimedia Commons / Lakshmi narasimha G (CC BY-SA)
Write down your target in a simple list. For example:
- Competitive multiplayer: 144 fps minimum
- Open‑world exploration: 60 fps smooth
- Simulation / racing: 90 fps flat
Having a clear number lets you filter out irrelevant data. If your GPU scores 200 fps in a synthetic test but you only need 60, the extra performance is wasted. Conversely, a score of 55 fps in your favorite game signals a problem.
Consistent benchmarking helps you track progress over time. Use the same settings, resolution, and in‑game location each run. [consistent benchmarking] ensures that any change you see comes from hardware tweaks, not random variation.
Remember that targets also depend on your monitor’s refresh rate. A 60 Hz display cannot show more than 60 fps, so pushing for 120 fps on such a screen is pointless. Match your expectations to the hardware you actually own.
Consider the game's engine. Unreal Engine 5 games often require higher frame times to maintain visual fidelity, while older titles like Counter‑Strike run smoothly at lower specs. Also consider frame time targets; a 16.6 ms frame time corresponds to 60 fps, while 6.9 ms matches 144 fps.
Run the Right Benchmarks for Your Game Type
Not every benchmark suits every genre. A synthetic test like 3DMark measures raw GPU power, but it may not reflect how a specific game engine uses that hardware. In‑game benchmarks, on the other hand, run the actual title with real assets and effects.
| Benchmark type | Best for | What it measures | Limitation |
|---|---|---|---|
| Synthetic (3DMark, Cinebench) | Comparing GPUs or CPUs across systems | Theoretical peak performance | May not match real game behavior |
| In‑game built‑in benchmark | Validating performance in a particular title | Real‑world fps in that engine | Only represents one game |
| Real‑time gameplay recording | Checking frame pacing and stutter | Actual frame times and drops | Requires manual analysis |
For competitive shooters, run the game’s built‑in benchmark at your monitor’s native resolution and max settings. For open‑world RPGs, use the in‑game benchmark but also test a busy area manually to catch texture streaming hiccups. Racing sims benefit from a benchmark that records lap times rather than raw fps, because consistent frame pacing is crucial for steering precision.
When you compare results, keep the settings identical. Switching from high to ultra can change fps dramatically, making any comparison unfair. [synthetic vs game benchmarks] explains why mixing the two leads to confusion.
A good practice is to run at least three different benchmarks: one synthetic, one in‑game, and one manual gameplay capture. This gives a balanced view of both raw power and real‑world behavior.
Read the Frame-Time Graph, Not Just the Average FPS
Average fps is a headline number, but it hides the details. A game that reports 90 fps might actually deliver a mix of 120 fps and 60 fps, creating a jarring experience. Frame times, expressed in milliseconds, show how long each frame takes to render.
A low, steady frame time indicates smooth motion.
Most modern benchmark overlays include a frame‑time graph. Look for spikes that jump above the average. For example, a baseline of 11 ms (about 90 fps) that suddenly spikes to 30 ms will cause a visible stutter.
Even if the average stays high, those spikes hurt immersion.
[frame times] provides a deeper dive into why milliseconds matter. In practice, you want the 99th percentile of frame times to stay close to the average. If the 99th percentile is double the average, you have a pacing problem.
When you spot a spike, check if it correlates with a specific event, such as a explosion or a new area loading. If it does, the issue may be CPU‑bound or related to asset streaming. Adjusting texture quality or disabling background apps can sometimes smooth out those peaks.
Tools like RTSS (RivaTuner Statistics Server) can log frame times in real time, helping you catch occasional hiccups. Use the 99th percentile metric; if it stays within 2 ms of the average, the experience will feel fluid.
Diagnose the Bottleneck: CPU vs. GPU vs. Memory
When your fps is lower than expected, the culprit is usually one of three components. The CPU feeds instructions to the GPU, the GPU renders frames, and memory stores the data they need. If any one of these is overworked, performance suffers.
Start by checking the GPU utilization in your benchmark overlay. If it stays below 90 percent while the CPU usage is near 100 percent, you are likely CPU‑bound. Conversely, high GPU usage with low CPU usage points to a GPU bottleneck.
[identifying bottlenecks] offers a step‑by‑step method for confirming this.
Memory can also limit performance. Insufficient RAM forces the system to swap data to disk, causing stutter. Look for high memory usage in the task manager; if it exceeds 80 percent of total capacity, adding more RAM often helps.
Dual‑channel memory configuration can improve bandwidth, which helps when the CPU needs to feed the GPU quickly.
For a quick test, run the same benchmark at two different resolutions. If fps drops sharply when you raise the resolution, the GPU is the limiting factor. If fps stays similar, the CPU is likely holding things back.
Manufacturer documentation can provide insight into how each component behaves. For example, NVIDIA GPU Boost describes how modern cards automatically increase clock speeds until they hit thermal or power limits, which can mask a CPU bottleneck.
Once you know the bottleneck, you can decide whether to upgrade the CPU, add more RAM, or improve cooling. Avoid spending money on a new GPU if the CPU is the true limit.
Match Your Settings to Your Monitor’s Refresh Rate
A 60 Hz monitor refreshes 60 times per second, so it cannot display more than 60 frames per second. If your benchmark reports 200 fps on that screen, you will still see only 60. The extra frames do not make motion smoother; they just generate heat and power draw.
Before you chase a higher number, check your monitor’s native refresh rate.
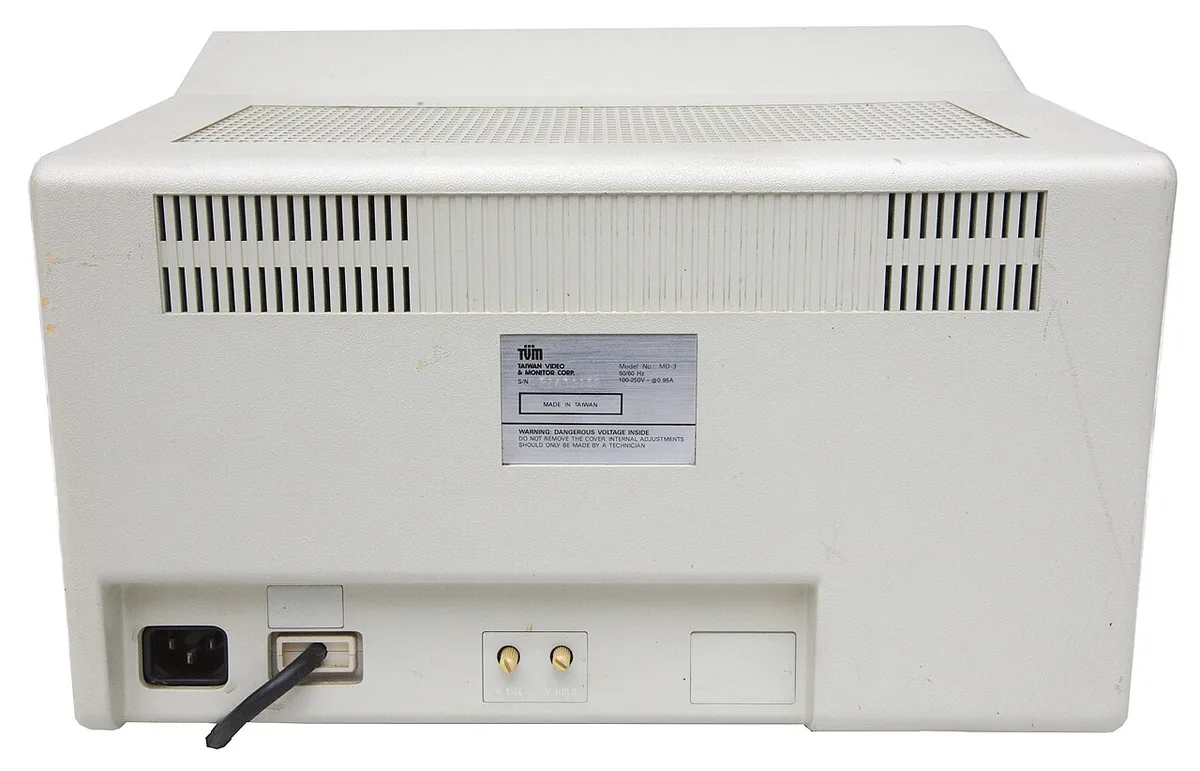
Image source: Wikimedia Commons / Pratyeka (CC BY-SA)
Match your in-game settings to that limit. On a 144 Hz display, aim for steady performance near 144 fps. On a 60 Hz panel, anything above 60 fps is overhead.
Technologies like G-Sync or FreeSync can reduce tearing when fps fluctuates below the refresh cap, but they do not create frames that do not exist.
Input latency also changes with refresh rate. A 144 Hz monitor shows new information sooner than a 60 Hz one, which matters in competitive shooters. reducing input lag helps you feel that difference.
For story-driven games, a stable 60 fps on a 60 Hz screen is usually enough.
Check your benchmark results against the refresh number. If the average sits well below it, lower settings or upgrade hardware. If it sits far above, you are wasting performance.
The goal is consistent frame delivery at or just above your monitor’s limit, not a meaningless peak score.
Variable refresh rate adjusts the monitor to match the GPU output, but it still has a ceiling. You cannot exceed the panel’s maximum hertz. Test your benchmark at the same resolution and refresh rate you plan to use.
A 240 Hz screen suits esports titles, while a 60 Hz panel works fine for single-player adventures.
Run the benchmark in fullscreen at native resolution. Windowed mode can cap fps differently. Record the 1 percent lows alongside the average to see if you stay above the refresh floor during intense scenes.
If your average is 200 fps but lows dip to 45 fps on a 60 Hz screen, you will still notice stutter. The refresh cap does not protect you from dips below it.
Manufacturer specs confirm that display refresh rates are hard limits. A panel rated at 60 Hz will not accept a higher signal without dropping frames. Check the official product page before assuming your monitor can handle more.
Fix the Weak Link Without Wasting Money
Once you know which part is holding back performance, spend money only where it helps. If your GPU runs at 100 percent while the CPU idles, a faster processor will not raise fps. That is a GPU bottleneck, and the fix is a stronger graphics card or lower settings.
spot a CPU limit before you spend.
If the CPU is maxed and the GPU waits, you have a CPU bottleneck. Adding RAM will not fix it unless memory usage is also near the limit. Overclocking can squeeze extra frames, but it raises heat and power draw.
Manufacturer specs confirm that sustained overclocking without adequate cooling shortens component life.
Undervolting is a lower-risk alternative. It reduces power draw and heat while keeping clocks stable. Aggregate reviews indicate that undervolting modern GPUs can lower temperatures by several degrees without losing fps.
This delays the need for a new card.
Motherboard and socket compatibility also constrain upgrades. A new CPU may require a different socket or chipset, forcing a motherboard replacement. Check your current board’s supported processor list before buying.
This hidden cost can turn a cheap upgrade into an expensive platform swap.
Timing matters. Prices drop when new generations launch, so waiting can save money. But if your current hardware misses your target today, an upgrade now improves daily use.
Weigh the immediate gain against the coming price drop.
Check memory next. If task manager shows 80 percent or higher usage during the benchmark, add RAM before touching the CPU or GPU. Dual-channel kits improve bandwidth and can smooth out frame times in CPU-heavy titles.
Cooling matters too. Thermal throttling forces clocks down, making a fast part look slow. Clean dust from heatsinks and reapply paste if temperatures climb past 85 to 90 degrees Celsius under load.
Prioritize the part that is actually limiting you. Buying the newest GPU when your CPU cannot feed it is wasted cash.
Common Interpretation Mistakes That Lead to Bad Upgrades
The biggest mistake is trusting average fps alone. A benchmark that reports 100 fps might dip to 40 during heavy scenes. Those dips cause stutter even when the average looks fine.
Always look at the 1 percent lows and frame-time variance.
Comparing scores across different settings is another error. Running Cyberpunk at 1080p medium and comparing it to 4K ultra is meaningless. Keep resolution, texture quality, and ray tracing identical for any valid comparison.
Synthetic tests measure theoretical peak, not real gameplay. A card that tops 3DMark charts might struggle in a specific game engine. Use in-game benchmarks for final decisions.
Buying upgrades based on a single number leads to poor purchases. If your system is CPU-bound, a new GPU will sit idle. sudden fps drops often point to software or thermal issues, not hardware limits.
Ignoring minimum fps is common too. A game that averages 90 fps but drops to 50 during a firefight will feel uneven. Check the lows before you conclude your hardware is fast enough.
Resolution scaling can mask problems. Dynamic resolution drops quality to maintain fps, so a benchmark might report steady numbers while the image looks blurry. Turn it off during testing to see raw performance.
Driver versions matter as much as hardware. A new graphics driver can change benchmark results by 10 percent or more. Always note the driver version when you record scores.
Comparing a benchmark run on old drivers to one on new drivers is like comparing two different cards.
Short benchmarks can mislead. A one-minute run might miss thermal throttling that appears after ten minutes. Run the test long enough for temperatures to stabilize.
Aggregate reviews suggest at least five minutes of sustained load.
Quick-Reference Decision Flowchart
Use this flow to decide what to do next. First, is your average fps above your target refresh rate and stable? If yes, no upgrade is needed.
If no, check utilization during the benchmark.
If GPU usage is at 95 to 100 percent and CPU is lower, upgrade the graphics card. If CPU usage is pinned at 100 percent and GPU is below 90 percent, upgrade the processor. consistent benchmark routine helps you verify any change after the swap.
If memory usage exceeds 80 percent, add RAM before spending on CPU or GPU. If frame times spike despite good average fps, the issue is pacing, not raw speed. Lower texture quality or close background apps.
For competitive play, prioritize stability over peak fps. For single-player titles, prioritize visual quality as long as frame times stay smooth.
Overclocking is a temporary fix, not a solution. It can raise fps by 5 to 10 percent, but only if thermal headroom exists. Otherwise it causes crashes and instability.
Budget tier matters too. Spending $400 on a GPU makes sense if your CPU can handle it. Spending the same on a CPU when your GPU is five years old does not.
Match the component tier to the rest of your system so neither part wastes the other’s potential.
Keep background apps closed during every run. Chrome tabs and Discord can steal CPU cycles and skew results. Record which programs were running so you can replicate conditions later.
After any change, rerun the same benchmark under identical conditions. Compare the new frame-time graph against the old one. Only then can you confirm the upgrade solved the real problem.
Frequently Asked Questions
What is a good average fps for gaming?
Sixty fps is smooth for most single-player games. Competitive players often want 144 fps or higher. Match the number to your monitor’s refresh rate.
Should I trust synthetic benchmark scores?
Synthetic scores show peak hardware capability. They do not always reflect real-game performance. Use them alongside in-game benchmarks.
How do I know if my CPU is bottlenecking?
Check utilization during the test. If CPU is at 100 percent and GPU is below 90 percent, the processor is the limit. stress test duration also matters for stability checks.
Is 144 fps worth it on a 60 Hz monitor?
No. A 60 Hz screen cannot show more than 60 frames per second. Extra frames generate heat without visible benefit.
Why does my fps drop even with a high average?
High averages hide frame-time spikes. Those spikes create stutter during explosions or new area loads. Check the frame-time graph.
Do I need to upgrade if benchmarks look fine?
Not necessarily. If your games run smoothly at your target settings, the hardware is sufficient. Upgrades only matter when performance falls below your needs.
How often should I rerun benchmarks?
Rerun after any driver update, hardware change, or major game patch. Aggregate reviews show that performance can shift with software updates. A quarterly check is enough for stable systems.
1 thought on “Decode Gaming PC Benchmarks: What the Numbers Really Mean”
Comments are closed.